
The Incident
Recently I received word that one of our Azure Data Factory pipelines was experiencing significant latency. At the heart of this pipeline is an Azure SQL Managed Instance that is used as a staging tier. I wasn’t very concerned about it being the problem as it’s run pretty much unnoticed for two years. After all, it’s a managed service. That means you never have to work on it right!?!
As I did due diligence investigating, it was clear that there was a large amount of network latency between our on-premise systems and this MI. I used the dbatools command Test-DbaNetworkLatency to verify this.
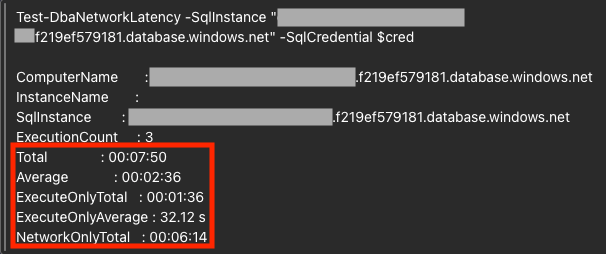
The nice thing about this command is that it separates latency caused by query processing from pure network overhead (NetworkOnlyTotal). Wow! Over 6 minutes of network-only traffic is certainly a problem!
Armed with this knowledge, I went to our network team in order to find out what on their side was causing problems. (To systems and data guys, the network is always the problem.) He found nothing wrong with our local networking or the VPN tunnel to Azure, but there had been a routing change in the public network around the same time that we started seeing issues. Problem solved? We decided to hang tight until this public networking issue cleared up.
The Twist
After a bit of time passed, some inconsistencies began to gnaw at me. For one, when I ran the same Test-DbaNetworkLatency command against another MI, there were no issues with network delay.
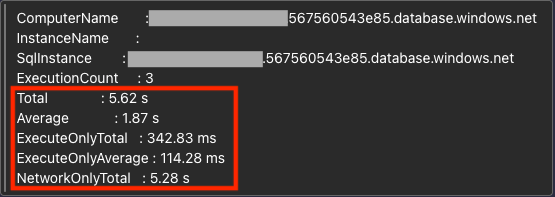
5.5 seconds is a far cry from 6 minutes. And that is using the same tunnel as the MI having problems. This ruled out the VPN and public network, isolating the issue to that specific MI.
Digging Deeper
I began to look into the troubled MI’s performance in greater detail. This was difficult since I could barely connect with the extreme latency. My go-to monitoring tool, Redgate Monitor, is normally an invaluable asset in these types of situations. However, it too was unable to consistently maintain a connection and therefore couldn’t provide me statistics.
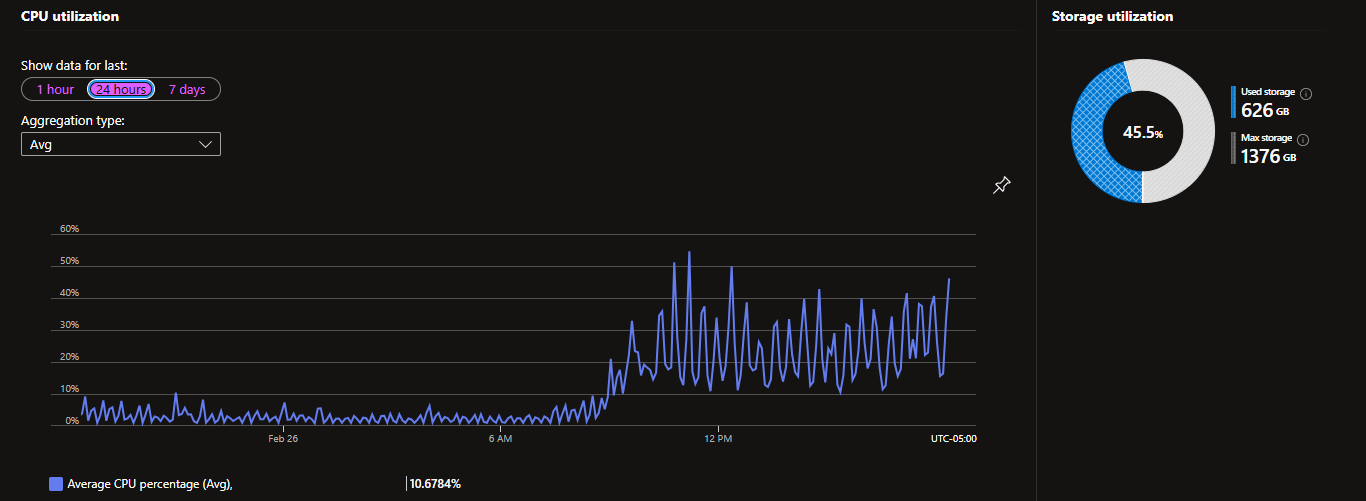
Azure Monitor, built into the Azure Portal, gave some CPU-related information. Looking at the 24 hour timeframe, things looked okay. There was elevated activity during business hours, but still hovering around 50% max.
Eventually, I was able to establish a connection in SSMS and begin hitting it with some queries against DMVs. I will admit unashamedly that Copilot was a fantastic assistant in this, and began to help me explore how the network latency could be a misdirection. In particular, it had me run this query to investigate how busy the CPUs were.
SELECT scheduler_id, runnable_tasks_count, work_queue_count, current_workers_count, active_workers_count
FROM sys.dm_os_schedulers
WHERE scheduler_id < 255
ORDER BY scheduler_id;
That query gave me results that looked like this:
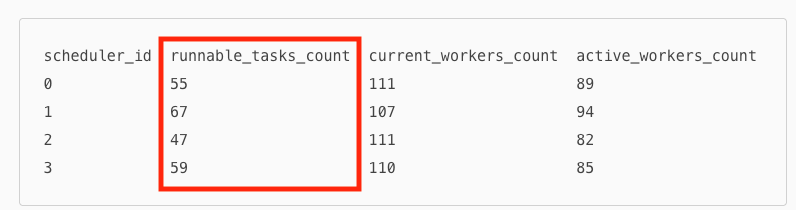
Yikes! You want the runnable tasks count to be low, preferably as close to 0 as possible. 10-20 is problematic, near 60 is devastating. This means that there are a lot of tasks waiting to be scheduled on a CPU, and therefore a lot of CPU pressure. Needless to say I was shocked, given the information above from Azure Monitor.
Another key query was this:
SELECT
    cpu_count,
    hyperthread_ratio,
    physical_memory_kb,
    committed_kb,
    committed_target_kb,
    visible_target_kb,
    sql_memory_model_desc,
    container_type_desc
FROM sys.dm_os_sys_info;
Looking at that, I found what was probably the most important clue.

Note the difference between the Physical Memory vs the Committed and Visible Memory. Even though I was provisioned over 20 GB of memory according to my vCore choice, only about 7.5 GB was available to me! Researching with Copilot, I began to develop a theory that the host our Azure SQL MI resided on was capping the resources available to it. That could be because it was over-provisioned or some other reason on their end, but being a managed service, this left me with only a couple of options to try and regain my full resource allotment.
- Restart the MI
- Scale the MI in hopes that this would kick the container off to a new host
Restarting didn’t change anything, so we decided to scale. After all, the beauty of cloud resources is that you can always scale back if needed.
“Network” Problems Resolved
Once the scaling finished, I again ran the same queries as above. As you might imagine, it took some time before everything leveled out (as is usually the case when a SQL Server instance starts up), but before long I received much better results.
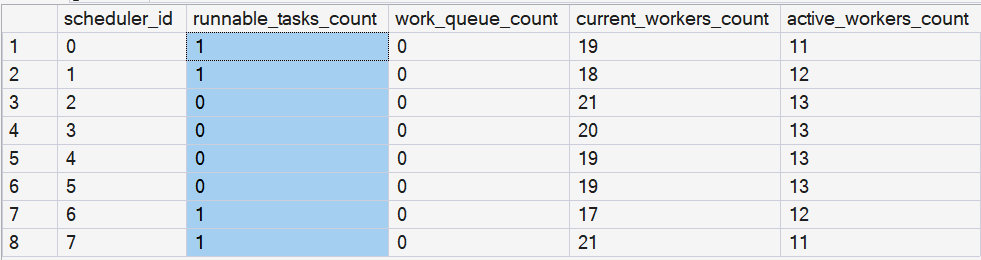
My runnable tasks count was now in line with where it should be, and the other worker counts were much better as well.

Critically, the MI was no longer capped. Its Visible Memory Target was able to surpass the previous 7.5 GB threshold and allow the instance to run with reasonable performance. There was now no evidence of network delay when running Test-DbaNetworkLatency.
With all of this in place, connections began to succeed and services returned to normal.
TLDR
In the end, our “network” problem was really just CPU and memory starvation masquerading as network latency. This makes sense when you think about it. Between the memory capping and the extreme CPU pressure, even simple operations like logins, metadata queries, and network handshakes were forced to wait on the scheduler for several seconds or minutes. On the client side, this appeared like network latency.
So if you run into network issues even though your network is fine, be sure to check for CPU and memory bottlenecks.
Leave a Reply